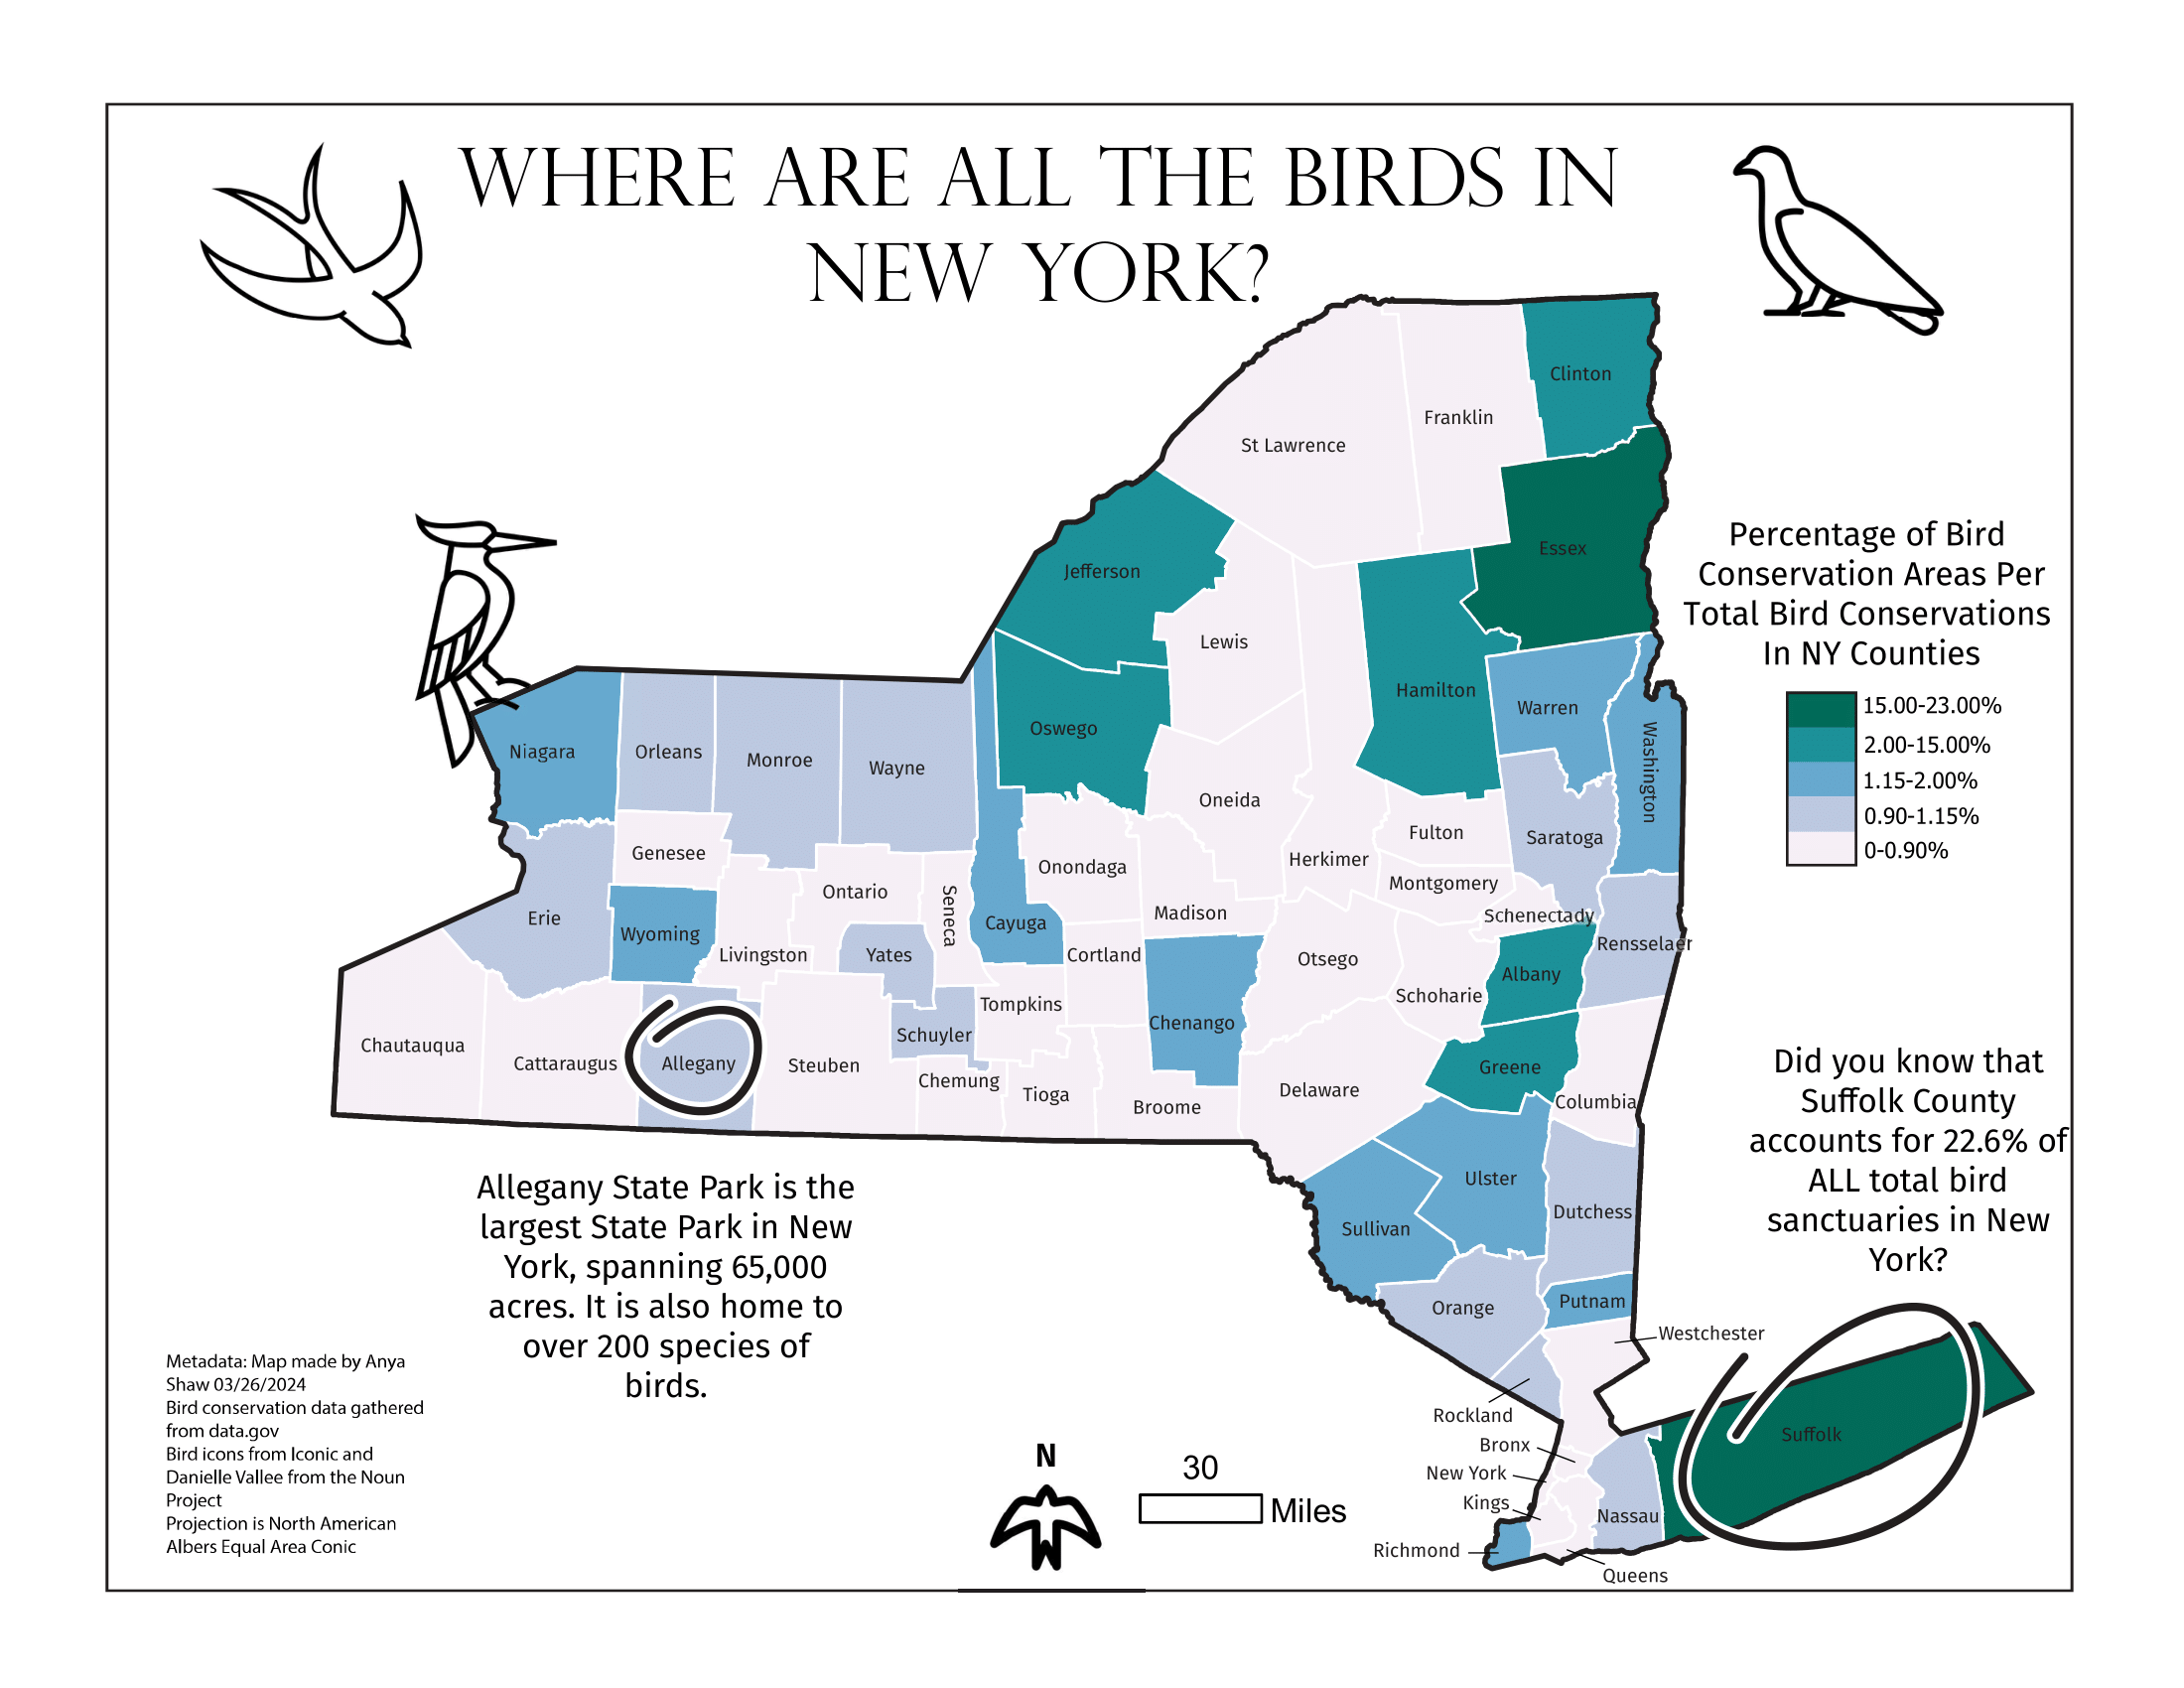
This project used open source data to create a choropleth map showing the distribution of birds throughout New York state. I learned about the importance of normalizing data in order to tell an honest and compelling story. The images around the side come from The Noun Project and add a cartoonish feel to the map. Additionally, the colors of the choropleth are color-blind friendly as I believe it to be very important to make maps accessible to all.